A Litter Bit Better! 2010 Stats
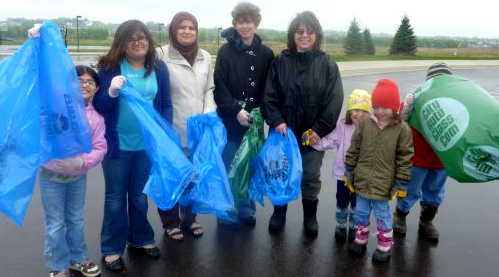
The final results of the 2010 city-wide litter pickup are in! 3,500 volunteers from across Rochester pitched in and picked up LOTS of trash.
At our annual “Trash Mountain” event, Waste Management scales recorded 300 pounds of recyclables, over a half ton of tires, 800 pounds of metal, amounting to 12.34 tons or 24,600 pounds of waste that were collected by a record 3,500 valiant A Litter Bit Better! volunteers. All of these materials were prevented from polluting our neighborhoods and water.
This is the first time in the four years of this event that total waste collected decreased. Is this program having an effect on littering behaviors? That remains to be seen. Organizers are hopeful that a new online survey offered this year will provide more insight from volunteers.
Some anecdotal highlights of this year’s event include:
- Total amount of litter collected was 15,600 pounds less than last year. Over half of the groups that responded to surveys said they found less litter in the areas they have collected in over multiple years.
- 2010 was the highest level of participation and greatest area covered yet, 3,535 volunteers collected litter from 6,100 acres Rochester.
- Survey results pointed to plastic bottles as the most commonly found item, found in 92% of respondents’ areas.
- Some of the strangest finds: A Bill Clinton mask, M80 shells, a Packer’s flag, what appeared to be a brain but turned out to be cabbage, a toy Shrek head, and a bra hanging from a tree (found by Boy Scouts!)
- 33% of survey respondents are adopting more environmental stewardship practices as a result of participating in ALBB.
If you see green and blue A Litter Bit Better! bags that have not yet been collected, please notify Mike Kraszewski, Public Works Department at 254-8169.
Photos of volunteers in action are posted on the RNeighbors facebook page. “Tagging” is encouraged!
Volunteers registered to represent their neighborhoods, churches, businesses, organizations, or themselves, as follows:
| Group Type | # of Groups | # of Registered Volunteers | % of Volunteers |
| Adopt a Highway Groups | 2 | 24 | 0.8% |
| Adopt a Park Groups | 1 | 10 | 0.3% |
| Businesses | 26 | 284 | 9.1% |
| Churches | 12 | 321 | 10.3% |
| Families | 58 | 247 | 7.9% |
| Individuals | 16 | 16 | 0.5% |
| Neighborhood Associations | 18 | 275 | 8.8% |
| Other Organizations | 17 | 212 | 6.8% |
| Schools | 155 | 1158 | 37.1% |
| Scouts | 35 | 528 | 16.9% |
| Service Groups | 5 | 46 | 1.5% |
| TOTALS | 345 | 3121 | 100.0% |
Have a comment? Join us on Facebook!
